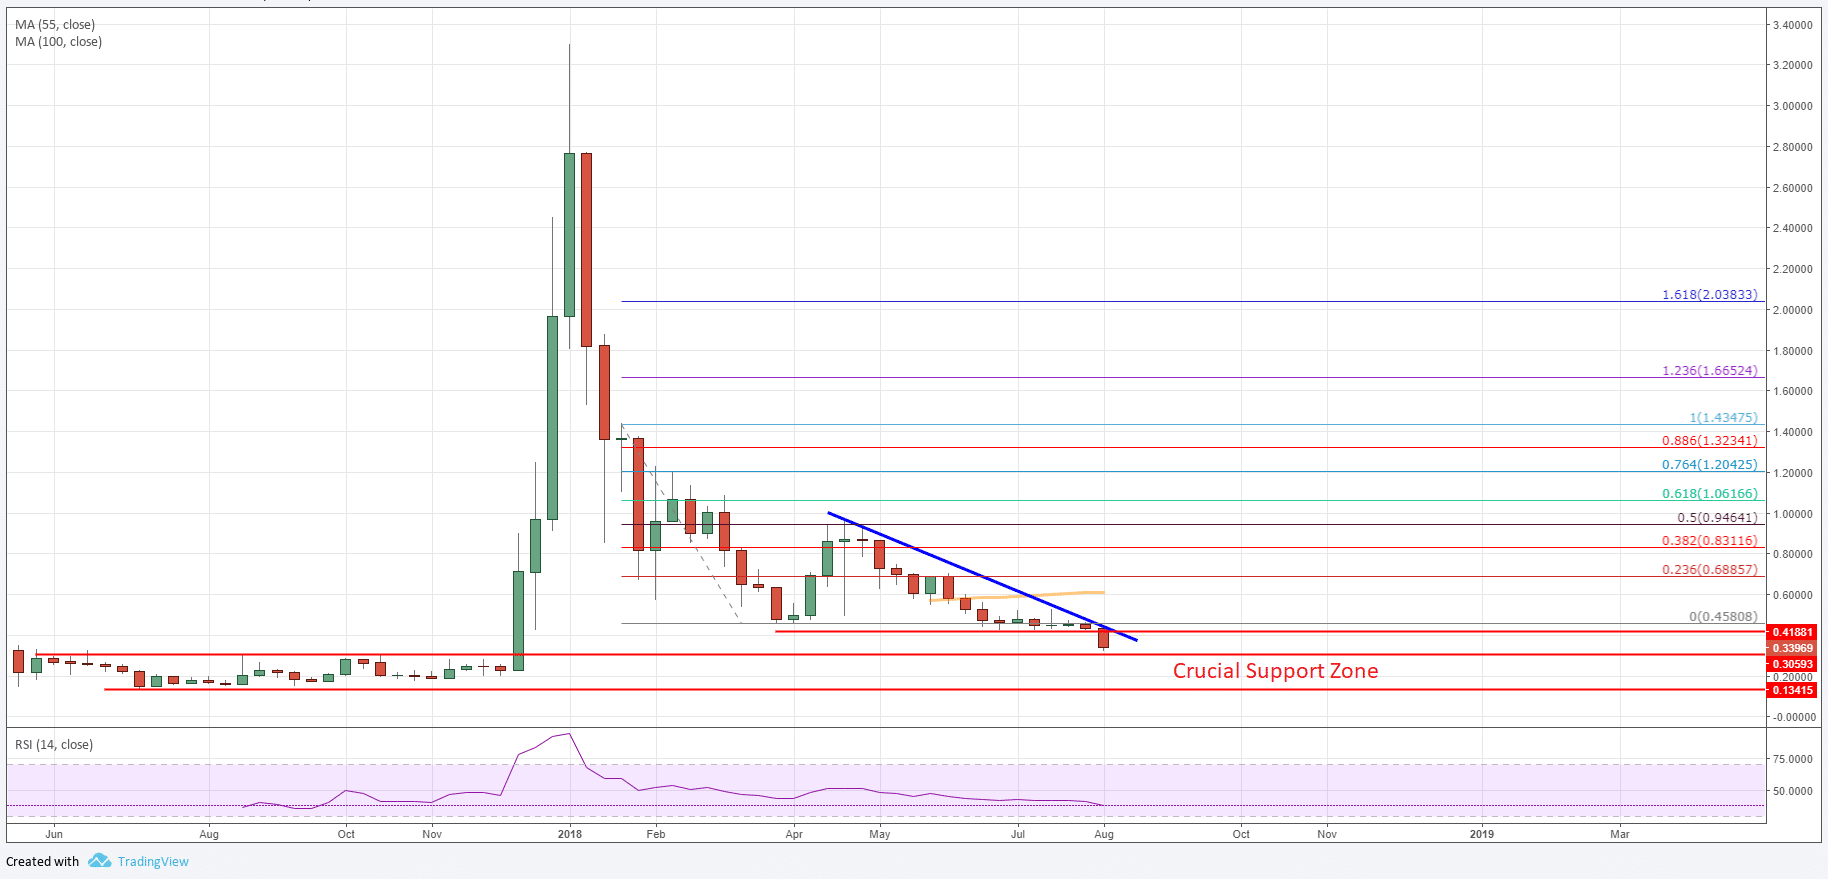
Ripple price failed to hold a significant support at $0.4245 against the US Dollar and declined. XRP/USD is now entering an important support zone formed in 2017.
There were heavy declines noted in the cryptocurrency market during the past three days. All major digital currencies declined, including bitcoin, Ethereum, ripple, EOS, bitcoin cash and litecoin. BTC/USD fell towards $6,200 and Ethereum declined below $400. More importantly, ripple broke a crucial support at $0.4245 and $0.4000 to enter into a medium term downtend.
Ripple Price Analysis, Chart and Key Takeaways (XRP/USD):
- Ripple price broke many important support such as $0.4245, $0.4000 and $0.3500.
- There is a monster bearish trend line in place with resistance at $0.4500 on the weekly chart of XRP/USD.
- The pair is moving lower and is about to enter a significant support zone formed in 2017.
Looking at the weekly chart, ripple price came under a lot of bearish pressure below $0.4500 and broke a key support at $0.4245 (as discussed in the last analysis). It even broke the $0.4000 and $0.3500 support levels to enter in a long term downtrend.
The last upside wave in April 2018 failed near a crucial resistance area at $0.9500 and the 50% Fib retracement level of the last drop from the $1.4354 high to $0.4580 low.
It seems like the price was rejected, resulting in a fresh bearish wave below $0.4500. However, ripple sellers need to be very careful going forward since XRP price is approaching yet another crucial support between $0.2000-0.3000.
Considering the long term outlook, the $0.2000-0.3000 support area holds a lot of importance. In 2018, the same area acted as base for the next major rally. The price rocketed from the $0.2000 zone to well above the $2.00 level.
Therefore, the $0.3000 and $0.2000 support levels are likely to act as strong barriers for buyers in the medium term. There is a possibility that ripple price could form a solid support base near $0.3000 in the coming weeks and then start a fresh recovery towards $0.4000 and $0.5000.


