Bitcoin price started a major uptrend from the $5,746 low against the US dollar. BTC/USD is now eyeing a test of the $10K resistance by the end of September 2018.
The past few weeks were very positive since bitcoin price likely formed a key bottom below the $6,000 level. A low was formed at $5,746 before the price started a significant rally. BTC/USD traded above the $7,500 and $8,000 resistance levels and is likely heading towards the $10,000 level.
Key Points
- Bitcoin price surged above the $8,000 level against the US Dollar.
- There was a break above two connecting bearish trend lines with resistance near $6,500 on the daily chart of the BTC/USD pair.
- The pair may perhaps slowly and steadily grind higher towards the $10,000 level.
Bitcoin Price Analysis (BTC/USD)
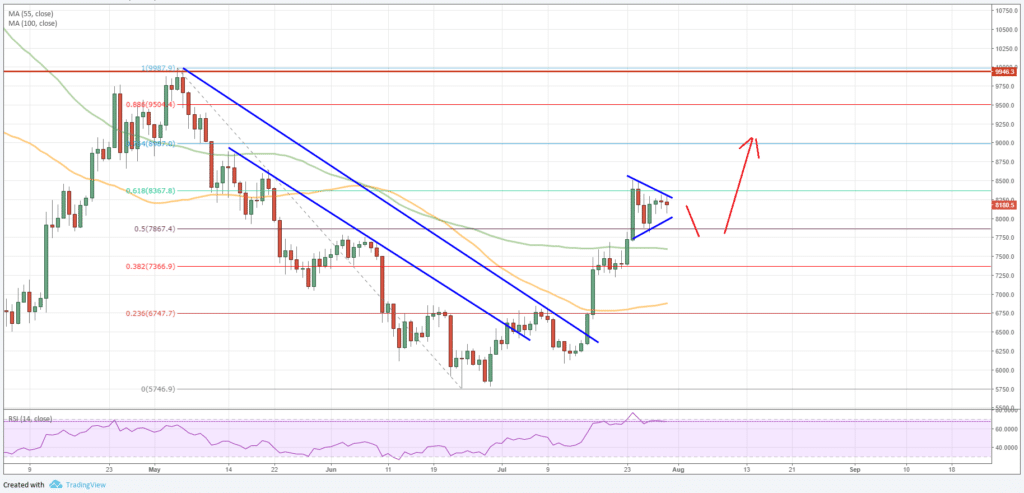
Bitcoin price formed a major bottom near the $5,750 level against the US Dollar. BTC/USD started and upward wave, broke many hurdles on the way up, and settled above the $7,500 resistance (chart data feed of Bitfinex).
During the upside move, the price cleared two connecting bearish trend lines with resistance near $6,500 on the daily chart. More importantly, there was a close above $7,500, and the 100 and 55 simple moving averages (day).
The price also broke the 50% Fibonacci retracement level of the last drop from the $9,987 high to $5,746 low. It opened the doors for more gains and the price traded above the $8,500 level.
However, the upside move was capped by the 61.8% Fibonacci retracement level of the last drop from the $9,987 high to $5,746 low. At the moment, the price is consolidating around the $8,000 level and is forming a short-term contracting triangle.
There could be a downside reaction, but the previous resistances near $8,000 and $7,800 are likely to act as key supports. The current price action suggests that the price may perhaps trade in a range before the next leg above $8,800.
Once there is a break above the $8,800 level, bitcoin price will most likely climb towards the $10,000 level in the coming weeks. On the downside, supports are seen at $7,800, $7,500 and the 100-day SMA.


Pingback: Ripple Price Analysis: XRP/USD Approaching Monster Break
Pingback: Ripple Price Analysis: XRP/USD Rally Could Extend Toward $0.40