Cardano price faced a lot of sellers during the past few days and declined below $0.50 against the US Dollar. ADA/USD and ADA/BTC price action and prediction calls for a bearish turn.
There was no major recovery in Cardano (ADA) in February 2018 and the price failed to move above the $0.50 resistance. It seems like the price is under a lot of bearish pressure and March 2018 could be another downfall month unless there is a break above $0.30. There was also an increase in bearish pressure on bitcoin, Ethereum and ripple, which caught the market attention.
Cardano Price (ADA/USD) Key Takeaways
- Cardano started a new downside wave recently and broke the $0.40 and $0.30 support levels against the US Dollar.
- There is a crucial declining channel forming with resistance at $0.30 on the daily chart of ADA/USD.
- The pair may decline further towards the next major support at $0.16.
- It also tumbled below the 0.000030BTC support versus bitcoin.
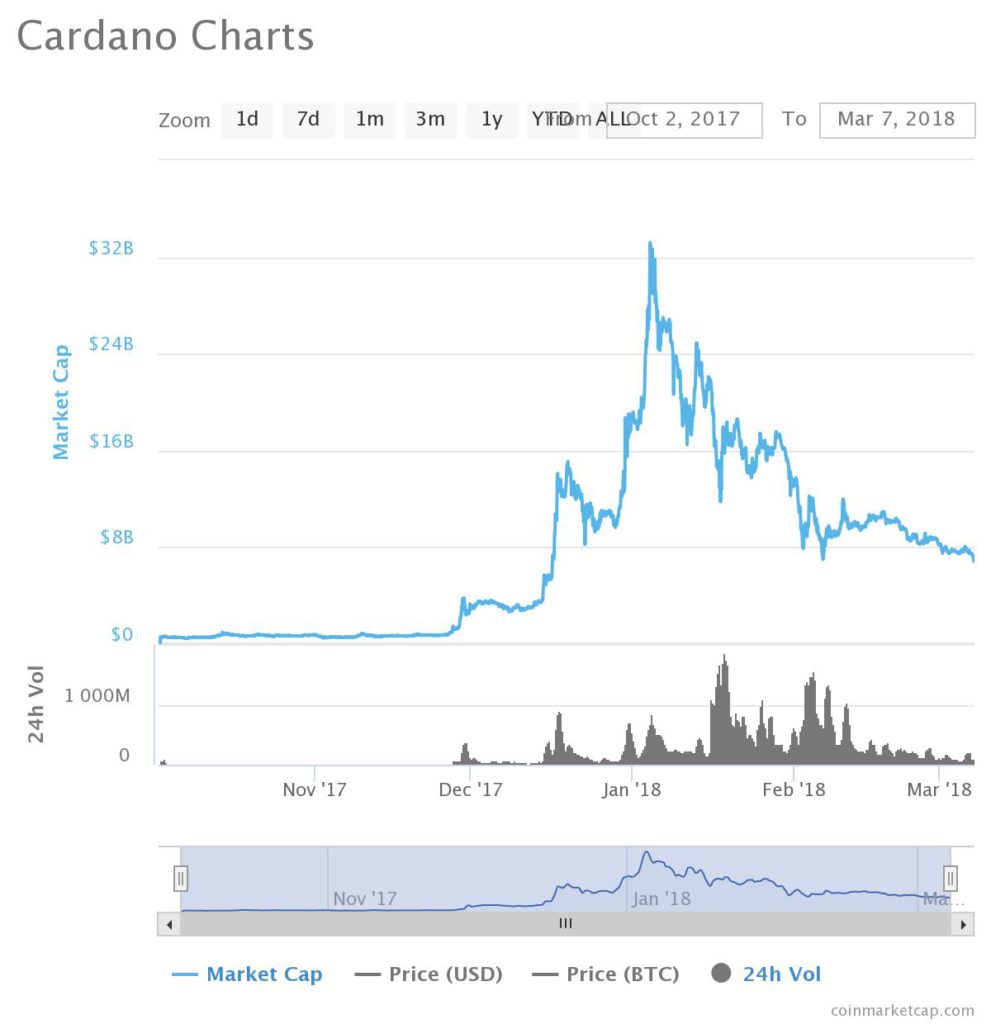
The past few weeks were mostly bearish as the market cap also moved down from well above $30 billion to well below $7 billion. With the current price of $0.269, the market cap stands at $6,978,711,796 (as per coinmarketcap).
Looking at the market cap chart, the $8 billion level was a major support zone. At the moment, the cap is well below $8 billion, suggesting a major increase in selling pressure.
Cardano Price Analysis, Prediction and March 2018 Forecast
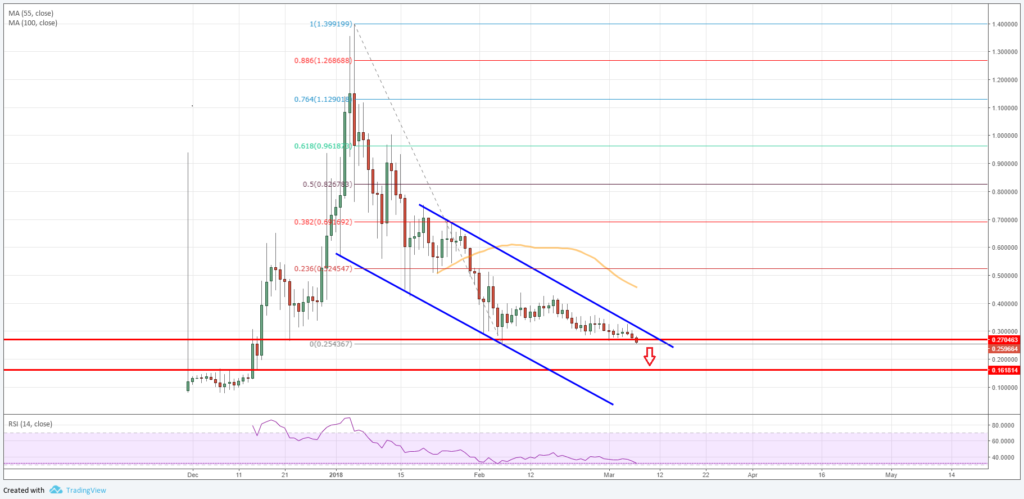
Looking at the daily chart of ADA/USD (tethered, binance), there is a clear downtrend in place from the $1.20 level. There was a sharp decline in prices from the $1.399 swing high.
During the decline, there was a break below a few key supports such as $1.00 and $0.60. Later, Cardano also moved below the $0.50 support level with a daily close. These are bearish signs with back to back red candles.
At the moment, ADA price is trying to break a major support at $0.27. If there is a daily close below the mentioned $0.27 level, there could be further increase in selling pressure. The next major support on the downside sits at $0.16.
More importantly, there is a crucial declining channel forming with resistance at $0.30 on the same chart. A break and close above channel resistance at $0.30 could trigger a substantial recovery.
The next major resistance is around the 23.6% Fib retracement level of the last decline from the $1.399 high to $0.2543 low at $0.5245. Above the $0.5200 level, the price may perhaps move towards the $0.75 level.
Overall, the current price action is bearish, but if Cardano moves above $0.30, there could a new upside wave towards $0.50 and $0.75.


Pingback: Ripple Price Forecast: XRP/USD Approaching Crucial Support
Pingback: Crude Oil Price Uptrend Intact Above $68.00