Litecoin price forecast is turning bullish once again after the recent correction towards $100. LTC/USD may perhaps gain upside momentum to retest the $200 and $260 levels.
The recent low formed in litecoin was around $105 (data feed via bitfinex). The price started a decent recovery and is currently showing positive signs with a break above the $140 resistance.
Key Points
- Litecoin price is gaining bullish momentum and it looks like a bottom is in place at $105.
- There was a break above a key bearish trend line with resistance at $140 on the daily chart of the LTC/USD pair.
- The pair may perhaps rise further towards the next major hurdles at $200 and $260.
Litecoin Price Forecast Points Further Gains
In January 2018, we saw a major decline in litecoin price as it nosedived from well above $350 to test the $100 level. However, the LTC/USD pair formed a base near $100 and is currently moving higher.
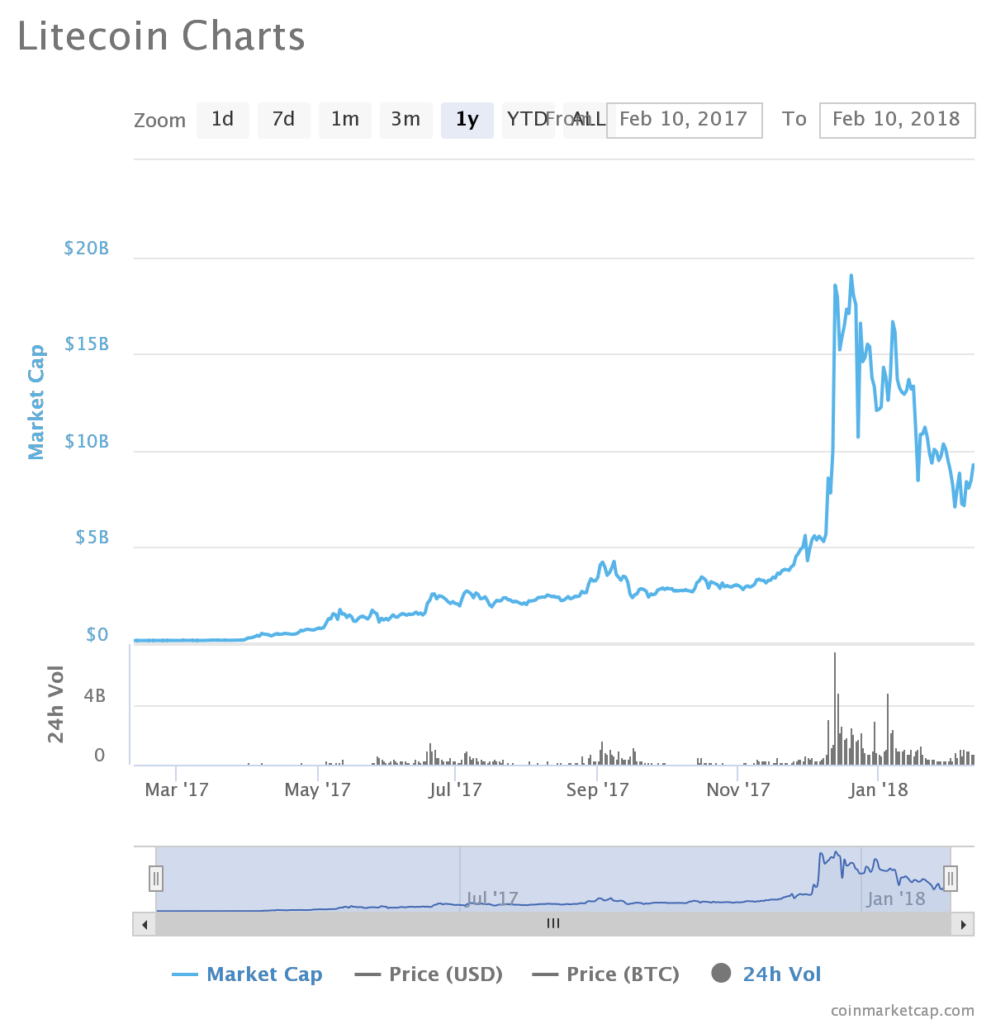
In terms of the market cap, Litecoin has slipped to the 6th position with value $9,198,314,083 (figures taken from Coinmarketcap). However, the price is slowly recovering and soon the market cap could break the $10,000,000,000 level.
The last major drop in the cryptocurrency market was very disruptive. Many investors caught in bad trades and lost money. However, the crypto market is now recovering, including BTC (as per our recent bitcoin price forecast). Other altcoins such as bitcoin cash, Ethereum and Ripple also recovered nicely.
Having said that, we need to see many more positive signs before calling it a trend change. The current market correction could be a correction as well, therefore, investors and traders need to trade accordingly.
LTC/USD Technical Analysis
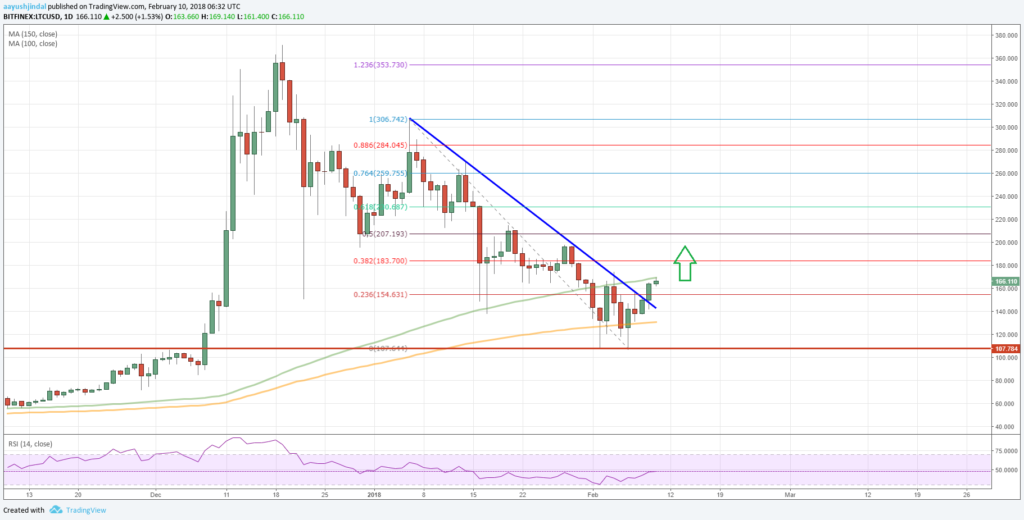
Let’s understand the current price action in the LTC/USD pair using the daily chart. It seems like the pair found a decent buying interest above the $100 support level.
A base was formed in litecoin price and it started an upside move with a break above the $120 resistance. During the upside move, the pair succeeded in breaking the 23.6 percent Fibonacci retracement level of the last decline from the $306 high to $107 low.
More importantly, there was a break above a key bearish trend line with resistance at $140 on the same chart. LTC price is now placed nicely above the 150-day simple moving average at $130.00, which is a positive sign.
Going forward, the price has to break the $170 resistance and the 100-day simple moving average. Once buyers succeed, the next stop could the 50 percent Fibonacci retracement level of the last decline from the $306 high to $107 low at $207.
Above $207, LTC could trade further higher towards the $260 level. On the downside, supports are at $140, $120 and $100. The current price action is positive, but investors need to be very careful since there is a lot of news lined up. A false break could easily put the price back in the bearish zone.
If you want more updates on Litecoin, Bitcoin and cryptocurrency market, you can follow us on twitter at finance_minutes.
Please note, this is not an investment advice. Read our disclaimer for more information.


Pingback: RPX Price (Red Pulse) Prediction, Binance Listing and Forecast
Pingback: Top Cryptocurrencies Worth Investing in 2018