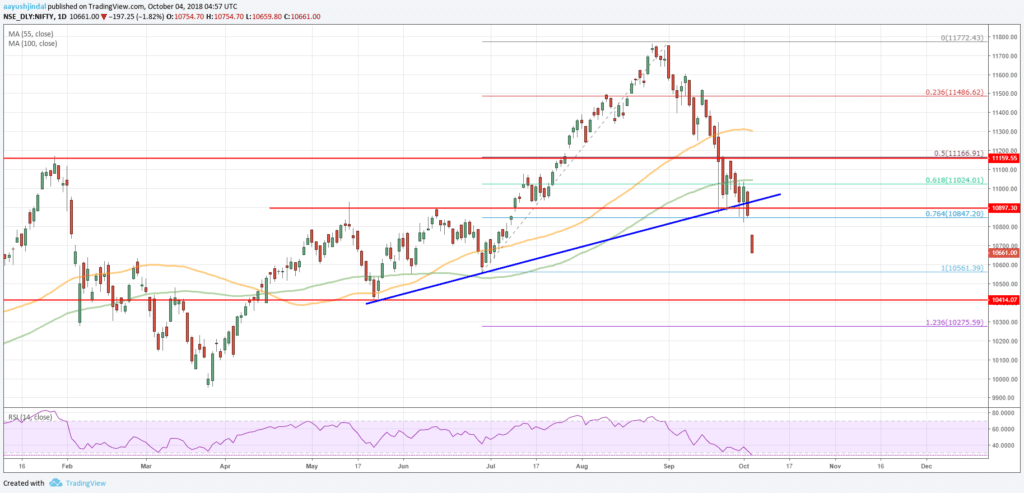
NIFTY 50 index broke the 11,000 support recently. The chart patterns indicate that there could be more losses in the Indian stock market and Sensex could slide further.
During the past few days, there was a sharp sell-off in the Indian equity market. The NIFTY 50 index topped near the 11,750 level in Sep 2018 and declined sharply this month. Indian Sensex also dropped heavily and broke the 36,000 support.
NSE Nifty 50 Index Daily Chart Analysis
Let’s look at the daily chart of NIFTY 50 and understand how the current market is trading and analyze the next key supports. There are clearly bearish signs visible on the chart from the 11,750 swing high.
The index dropped heavily and broke the 11,660 and 11,500 support levels. There was also a close below the 11,000 support, 100-day SMA, and the 150-day SMA. More importantly, there was a break below a major bullish trend line on the same chart at 11,000.
Additionally, the index cleared the 76.4% Fib retracement level of the last wave from the 10,561 low to 11,772 high. These all are bearish signs and indicate that the index is at risk of more declines towards the 10,400 and 10,200 levels.
An immediate support is around the last swing low at 10,561, below which the NIFTY 50 index could decline towards the 10,400 support. Below this, the next major support for buyers is near the 10,275 level.
The stated 10,275 level is the 1.236 Fib extension level of the last wave from the 10,561 low to 11,772 high. On the other hand, if the NIFTY 50 index corrects higher, the previous supports near 11,000 are likely to protect further upsides.
Furthermore, the 11,150 level is also a strong resistance, which is a pivot level and coincides with the 100-day SMA and the 150-day SMA.
The overall price structure is bearish for the Indian stock market, Sensex and NIFTY index. Unless the Indian Rupee recovers versus the US Dollar, there could be a lot of pressure on buyers of equities. USD/INR must drop back below $70.00 to gain investors’ confidence in the near term.


Pingback: Stock Market Update: Sensex, Nifty Recovery to Continue?