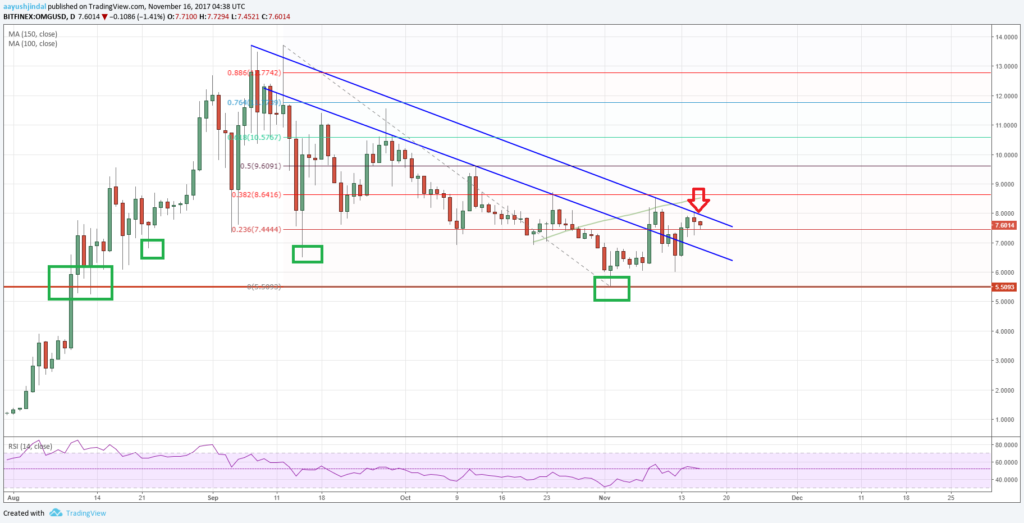
OmiseGO price started a major correction from the $13.65 level against the US Dollar. OMG/USD is now preparing for the next major break.
Key Points
- OmiseGO price after a major bull run found sellers near $13.65 (Data feed via Bitfinex) and started a downside correction against the US Dollar.
- There is a major connecting bearish trend line forming with current resistance at $8.00 on the daily chart of OMG/USD.
- A daily close above $8.00 could open the doors for a major upside move in the near term.
OMG/USD Long Term View & Chart Analysis
Since the launch, we saw a major upside move in OmiseGO price as it moved above the $10.00 handle and traded as high as $13.69 against the US Dollar. It was one of the best cryptocurrencies and gained heavy traction a few months ago. Later, the OMG/USD pair found sellers and started a downside correction below $10.00. Bitcoin price rise was one of the reasons of the recent decline below $10.00.
The pair declined and even traded below the $6.00 support. A low was formed near $5.50 where buyers appeared. It is now moving higher and moved a few points above the 23.6% Fib retracement level of the last downside move from the $13.69 high to $5.50 low.
During the recent upside, there was a break above a major bearish trend line with resistance at $7.00 on the daily chart of OMG/USD. However, the pair is currently facing another crucial connecting bearish trend line with current resistance at $8.00.
A break and daily close above $8.00 is required for buyers to gain control. Once there is a break of the $8.00 handle, the price could easily pierce the 38.2% Fib retracement level of the last downside move from the $13.69 high to $5.50 low.
The next stop could be the $9.60 level and the 50% Fib retracement level of the last downside move from the $13.69 high to $5.50 low. Any further gains should easily push the price above $10.00.
Can OmiseGO Price Stay above $5.50-6.00?
On the downside, the $5.50 low and the $6.00 support holds a lot of importance. If the price fails to move above the $8.00 resistance, the mentioned $6.00 support could be at risk.
The daily RSI for OMG/USD has just moved above the 50 level, which is positive sign in the near term.
Trade safe traders and enjoy the ride!!!


Pingback: Dogecoin Price 2018 Forecast: Can Doge Be Among Top 20?