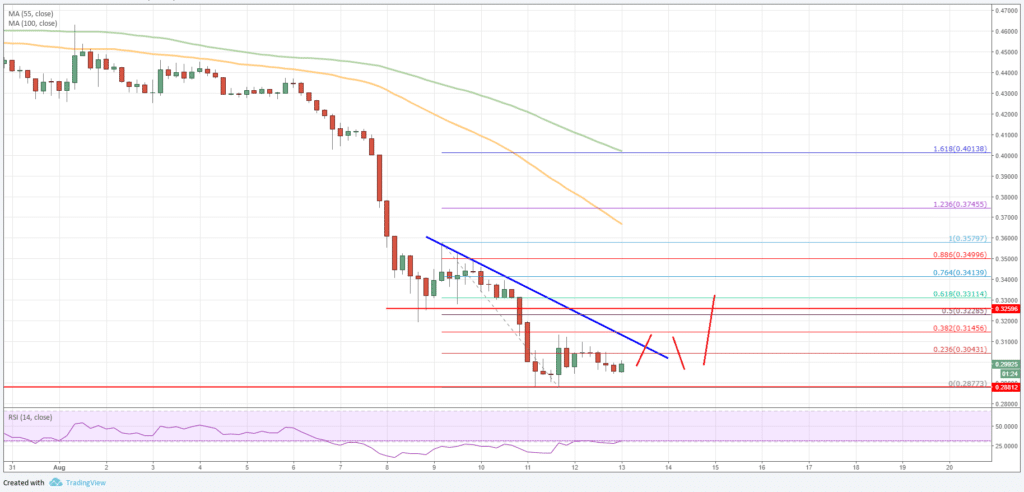
Ripple price dropped significantly and broke the $0.3200 and $0.3000 supports against the US Dollar. XRP/USD traded as low as $0.2880 and it could correct higher in the short term.
The past few days were very bearish in the cryptocurrency market since many major coins traded to new yearly lows. Bitcoin, Ethereum, BCC, ripple, EOS and litecoin tumbled and broke many important support levels. BTC/USD retested the $6,000 support zone, Ethereum tested the $300 handle, and ripple price traded below the $0.3000 support.
Ripple Price Analysis, Chart and Key Takeaways (XRP/USD):
- Ripple price traded to a new yearly low below the $0.3000 support areas.
- There is a major bearish trend line formed with resistance at $0.3050 on the 4-hours chart of XRP/USD.
- The pair may perhaps correct a few points higher above the $0.3000 and $0.3050 in the short term.
Looking at the 4-hours chart, ripple price fell sharply after it broke the $0.3200 support. It cleared the $0.3000 handle and traded close to the $0.2850 support. A new yearly low was formed near $0.2880 and the price is currently consolidating losses.
In the last analysis, we discussed that XRP price is entering the 2017 support zone near $0.2500. The price extended declines and it has entered the $0.2200-0.2800 support zone. The mentioned levels acted as a support base in 2017 for a solid rally above the $2.00 level.
Therefore, there are high chances that ripple buyers could put up a fight above the $0.2200-0.2500 support area. In the short term, the price is currently consolidating gains above the $0.2800 level.
On the upside, an initial resistance is near the 23.6 percent Fibonacci retracement level of the last decline from the $0.3579 high to $0.2877 low. There is also a major bearish trend line formed with resistance at $0.3050 on the same chart.
Therefore, a break above the $0.3050 and $0.3070 levels could open the doors for a decent recovery in ripple price in the short term. In the mentioned case, the price could rebound towards the $0.3200 level, which is the 50 percent Fibonacci retracement level of the last decline from the $0.3579 high to $0.2877 low.


