Ripple price forecast 2018 remains positive above $2.00 against the US Dollar. XRP/USD might rise further to new highs during the coming months.
The recent upside rise in 2017 was very solid as Ripple achieved new milestones such as trading above the $1.00 and $2.00 resistance levels. It traded as high as $2.44 (data feed via Bitfinex) before starting a downside correction.
Key Points
- Ripple price remains well supported above the $1.2000 level against the US Dollar.
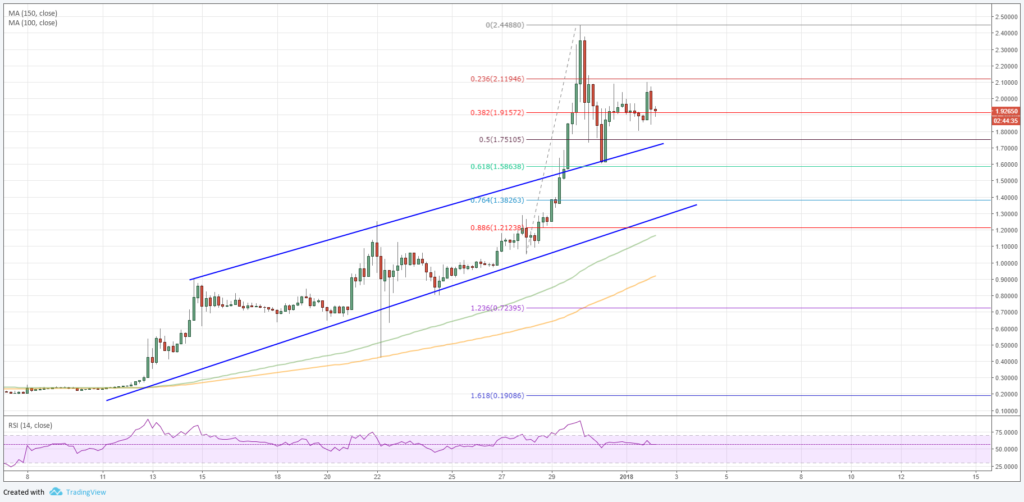
- There was a break above a major ascending channel with resistance at $1.7000 on the 4-hours chart of the XRP/USD pair.
- The pair remains in a bullish trend for 2018 and it might continue to rise.
Ripple Price Forecast 2018 Remains Positive
In 2017, we saw a solid increase in Ripple price as it moved above the $1.0000 handle and traded to a new all-time high of $2.4488. There are many positive signals developed for XRP/USD, which are pointing to the fact that the pair remains in a bullish trend.
In terms of the market cap, Ripple has surpassed Ethereum market cap of $84,386,321,695 and the current market cap of XRP with price as $2.25 is $87,163,850,689 (figures taken from Coinmarketcap).
Aayush Jindal, a senior market analyst discussed recently how Ripple XRP is best for payments and better than Ethereum and Bitcoin. Therefore, it’s not surprising to see XRP above Ethereum in terms of the market cap.
It seems like there is a lot of positivity built around Ripple and its price may continue to remain in the bullish zone.
XRP/USD Technical Analysis
Let’s analysis the price action for the XRP/USD pair via the 4-hours chart. The pair started a gigantic uptrend from the $0.2000 swing low and moved above a monster resistance at $1.0000.
The pair also succeeded in settling above both the 100 and 150 simple moving averages on the same chart with a close above $1.6500. More importantly, there was a break above a major ascending channel with resistance at $1.7000.
The pair traded to a new all-time high of $2.4488 and is currently correcting lower. It has breached the 50% Fibonacci retracement level of the last wave from the $1.05 low to $2.44 high.
However, the broken channel and the 61.8% Fibonacci retracement level of the last wave from the $1.05 low to $2.44 high acted as a decent support and are currently holding losses in Ripple price.
Once the current correction is complete, XRP is likely to resume its uptrend above the $2.00 handle. Above the last high of $2.44, the price may trade above $3.00 during the coming months.
Trade safe traders and enjoy the ride!!!


Pingback: Bitcoin Price Today: BTC/USD Building Bullish Scenario
Pingback: TRON (TRX) Price Forecast and Future Prospects
Pingback: Ripple Price Forecast: XRP/USD Bulls are back!!
Pingback: Ripple Price Weekly Forecast: Here is How XRP/USD Can Recover