Ripple price forecast remains bullish versus the US dollar and bitcoin. Both XRP/USD and XRP/BTC pairs moved above key resistance levels and are currently consolidating before the next move.
The start of 2017 brought a lot of weakness in cryptocurrencies and Ripple also declined sharply. It traded as low as $0.57 versus the USD and 0.0000846 versus BTC. Later, the market turned green and all major digital currencies such as bitcoin, Ethereum, ripple, bitcoin cash, litecoin and Dash recovered nicely
- Ripple price made a nice upside move and traded above the $0.9000 resistance against the US dollar.
- There was an upside break above a major declining channel with resistance at $0.9000 on the 4-hours chart of the XRP/USD pair.
- There were gains in the XRP/BTC pair as well as it moved above the 0.00010BTC resistance.
Ripple Price Forecast Bullish Again?
Looking at the current price action in the cryptocurrency market, there are many positive signals. All major pairs like BTC/USD, ETH/USD, LTC/USD and BCH/USD recovered a lot. This highlights the fact that the last negative sentiment has decreased on Ripple price as well. Both the major pairs XRP/USD and XRP/BTC may continue to gain momentum.
The most important bullish signal is the fact that bitcoin price has moved above the $10,000 resistance levels. It has opened the doors for more gains in altcoins as well. The market cap of Ripple rose above $40,000,000,000 (as per data provided by coinmarketcap), which is a positive sign.
LTC/USD also performed well, and as per our last litecoin price forecast, there was an upside move above $200. The next major hurdle for buyers is now at $250.
XRP/USD Technical Analysis
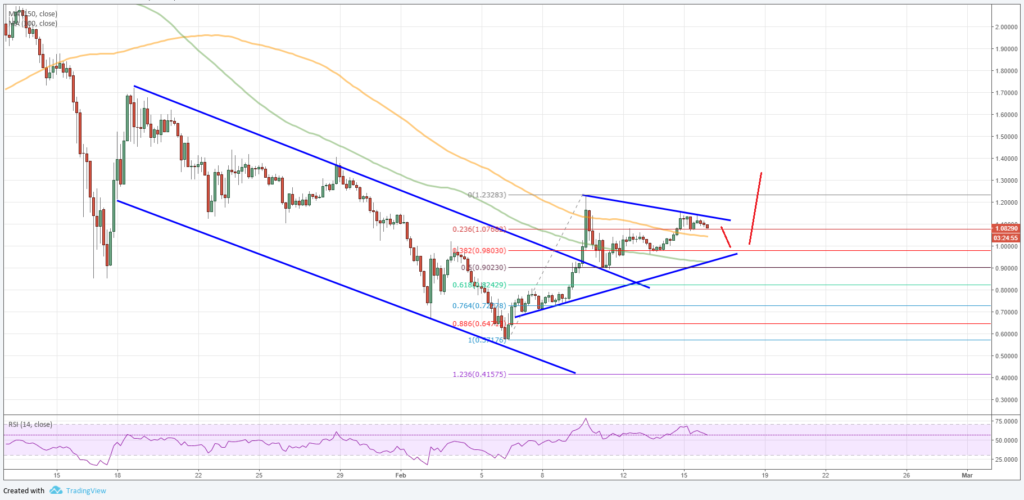
Let’s start with the 4-hours chart of XRP/USD, which highlights a positive bias from the $0.5700 swing low. After a major decline in ripple price a low was formed near $0.5700 and a recovery was initiated.
The pair moved higher and broke a major declining channel with resistance at $0.9000 on the same chart. More importantly, the pair moved above the $1.0000 resistance, 100 simple moving average (green, 4-hours) and the 150 simple moving average (orange, 4-hours).
These are positive signs and suggest that the pair is back in the bullish zone above $1.0000. It traded as high as $1.2328 (data feed by Bitfinex), and is currently consolidating. A contracting triangle is forming with current support at $0.9800.
As long as the price is above the $0.9800 level and there is no close below 100 SMA, there could be more gains above the $1.20 level in the near term. On the upside, the next major resistance is at $1.50 and $1.60.
XRP/BTC Technical Analysis
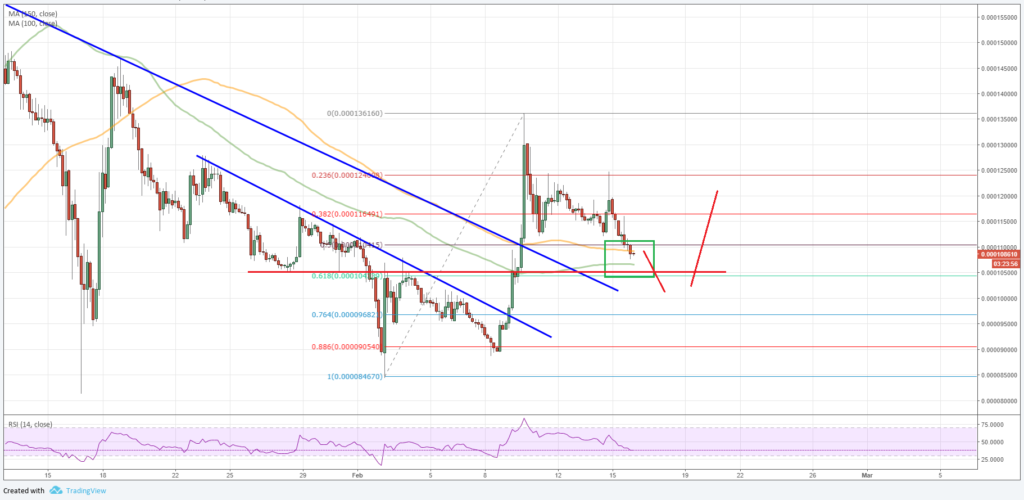
Looking at the 4-hours chart of XRP/BTC, there was a support base formed near 0.000080BTC. The pair started an upside move and traded above the 0.00010BTC resistance.
During the upside move, the pair broke two important bearish trend lines at 0.000096BTC and 0.0000105BTC. It settled above the 100 simple moving average (green, 4-hours) and the 150 simple moving average (orange, 4-hours), and traded as high as 0.000136BTC.
Later, a correction wave was initiated and the pair is currently trading near the 50% Fib retracement level of the last wave from the 0.000084BTC low to 0.000136BTC high. Moreover, the 100 and 150 SMA’s are protecting declines. If the price stays above the 0.00010BTC support, it could resume its uptrend in the near term.
The overall bias is positive and it seems like Ripple price may continue to rise against the US dollar and bitcoin. There may be an extended correction, but it could be limited. Traders need to watch the mentioned support levels to avoid a false break.


