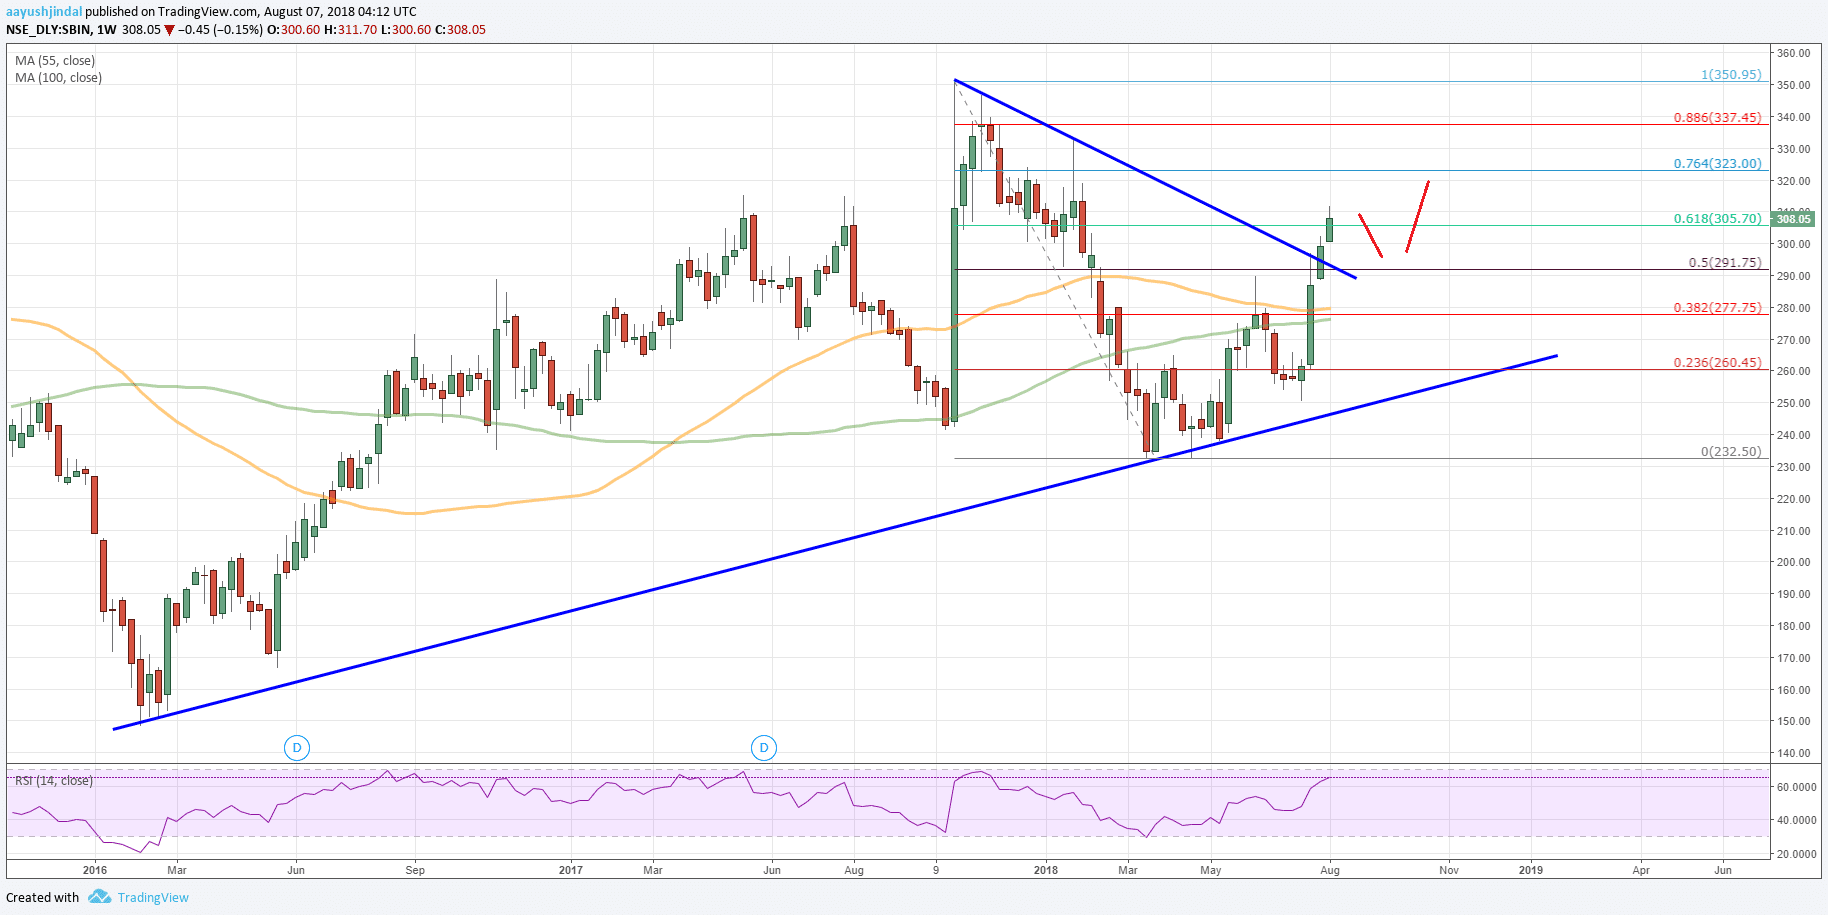
SBI share price made a nice upside move recently after forming a base near 232. It seems like NSE: SBIN (State Bank of India) could continue to trade higher towards 325 and 335.
There was a sharp downside move in SBI share price during the start of 2018. The price dipped from the 350 high and broke many support levels such as 320, 300 and 250. It traded as low as 232.50 and is currently recovering.
Let’s analyze the weekly chart of NSE: SBIN and try to find out how the State Bank of India share price could trade in the coming weeks since it has formed a decent bottom near the 232.00 level.
SBI Share Price Forecast: NSE: SBIN
- A solid support base is formed near the 232.00 level.
- There was a break above a key bearish trend line with resistance at 290.00 on the weekly chart of NSE: SBIN.
- The share price could accelerate higher towards the 325 and 335 resistance levels.
Looking at the weekly chart, the price started a solid upward move after trading as low as 232.50. It broke the 280.00 resistance and the 50 percent Fibonacci retracement level of the last drop from the 350.95 high to 232.50 low.
More importantly, there was a close above the 260 level and the 100-week simple moving average (green). SBI share price also broke a key bearish trend line with resistance at 290.00 on the weekly chart.
The price is now placed nicely above the 280 and 300 levels. It seems like it could continue to move higher towards the next resistance at 325.00, which is near the 76.4 percent Fibonacci retracement level of the last drop from the 350.95 high to 232.50 low.
Above this, the price may possibly rise towards the 335.00 level in the near term. The final target could be near the last high at 350.00 if all goes well and buyers remain in action.
On the flip side, if SBI share price (NSE: SBIN) slides from the current levels, it could test the 280 support level where buyers are likely to emerge again.


Pingback: FD Interest Rates Revised: SBI vs. HDFC Bank Vs. ICICI Bank and Others