Indian Rupee declined heavily during the past few week as USD to INR traded above 69.00. However, the daily chart now indicates that INR could be recover in the short term.
Let’s try to understand the current price action for Indian rupee versus the US dollar using the daily chart of USD/INR.
Key Points
- A short-term top is forming around the 69.00 level for USD Vs INR.
- The price broke a connecting bullish trend line with support at $68.60 on the daily chart.
- Indian Rupee may perhaps recover further towards the $67.50 level in the near term versus the US dollar.
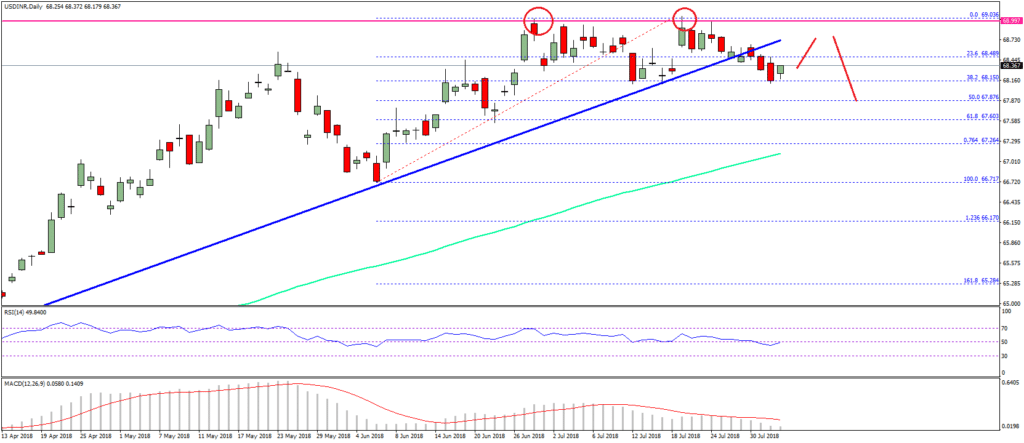
Looking at the daily chart of USD to INR, the price rallied above the 66.00 level. It even moved above the 68.00 level, but it failed to gain momentum above 69.00.
There were more than two attempts by Indian rupee sellers to break the 69.00 level, but they failed. As a result, a top formed near the 69.00 level and the price moved lower. During the decline, the price broke the 68.80 support.
More importantly, there was a break below a connecting bullish trend line with support at $68.60 on the daily chart. US Dollar also traded below the 23.6 percent Fib retracement level of the last wave from the 66.71 low to 69.03 high.
It even moved below the 68.50 support, but the 38.2 percent Fib retracement level of the last wave from the 66.71 low to 69.03 high acted as a support.
At the moment, the price is correcting higher and is trading near the 68.40 level. US dollar may continue to rise towards the 68.50 and 68.80 levels, but it is likely to face sellers near 69.00 versus Indian rupee.
If there is another failure to break past the 68.80 and 69.00 resistance levels, USD to INR could drop sharply. In the mentioned case, the price could break the 68.35 low and the 68.00 support.
On the downside, the next important support is near 67.80 for USD/INR. Below this, Indian rupee buyers could gain traction for a test of 67.50.
Overall, the recent failure near 69.00 was significant and it may possibly ignite downsides in USD/INR in the near term.


